
 Roanoke Valley Market Snapshot
Q2 – 2019
By: Patrick Wilkinson
Posted 7/9/2019

Welcome to LivingInRoanoke.com’s Market Snapshot! You are very special to me, so please enjoy…
Here you’ll find in-depth analysis, graphs and data, of residential real estate sales for the Roanoke Valley of Virginia based on data from RVAR. Be sure to see trends in mortgage interest rates at the end. You are welcomed to share this with your friends, and share on Facebook or Twitter (just click share buttons at the bottom of the page). Here’s the Roanoke Valley Market Snapshot Q2 – 2019. Thanks! Patrick
OVERALL THOUGHTS ON Q2 – 2019
Sales of residential homes in the Roanoke Valley have been heavy in the second quarter of 2019 with a total of 1,625 homes sold. Total for first half of 2019 is 2,712 homes (up 1.27%, over first half 2018). 2019 is setting up to be the best year since 2005. There are many more buyers, but WAY fewer homes to choose from, so sellers are finally doing great! Here are two terms to remember to understand the “housing shortage” phenomenon.
First, “Active In Range” (or AIR) means number homes that were on the market during a specific time period. The Q2 AIR has significantly decreased each year since 2011 (which was a very hard year for real estate), and is at its lowest point right now since 2001. This is good news for home sellers, and means well-priced homes are selling quite briskly.
– In Q2 of 2019 there were 4,157 homes AIR (lower is better!)
– In Q2 of 2018 there were 4,574 homes AIR
– In Q2 of 2017 there were 4,862 homes AIR
– In Q2 of 2011 there were 6,625 homes AIR (hard times)
And second, “Absorption Rate” which is the rate, expressed in months, at which the entire supply of homes will sell out. According to an article by NAR “six months’ supply is considered a balanced market.” The Q2 2019 Absorption Rate for the Roanoke Valley is 3.23 months (extremely low).
This sets up 2019 to be an excellent year for home-sellers. But sellers only do well if buyers have access to great loans. Interest rates have come down during the last month. We are still seeing historically low mortgage interest rates and excellent loan programs available to home buyers. Take a look at today’s mortgage interest rates at the end of this post.
2nd Quarter – 2019 – HOME SALES
– Chart below illustrates Q2 home sales for each year from 2000 to 2019.
– Average Q2 home sales during those 20 years equals 1,394 homes
– Q2 2019 sales (1,625) are higher by 231 homes (16.57% up) over 20-yr Q2 avg (1,394)
– Q2 2019 sales (1,625) are lower by 5 homes (0.30% down) from Q2 2018 (1,630)
![]()
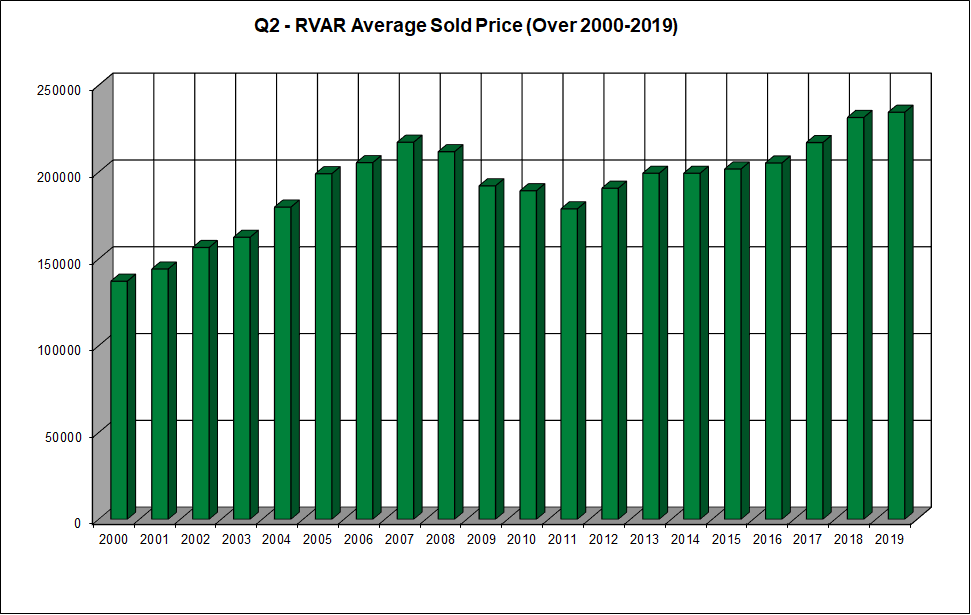
2nd Quarter – 2019 – AVERAGE PRICE (NEW ALL TIME Q2 HIGH!)
– Chart below illustrates Q2 average sales price for each year from 2000 to 2019.
– Average Q2 home sales price during those 20 years equals $192,647
– Q2 2019 avg price ($234,465) is higher by $41,818 (21.71% up) over 20-yr Q2 avg ($192,647)
– Q2 2019 avg price ($234,465) is higher by $2,979 (1.29% up) from Q2 2018 ($231,486)
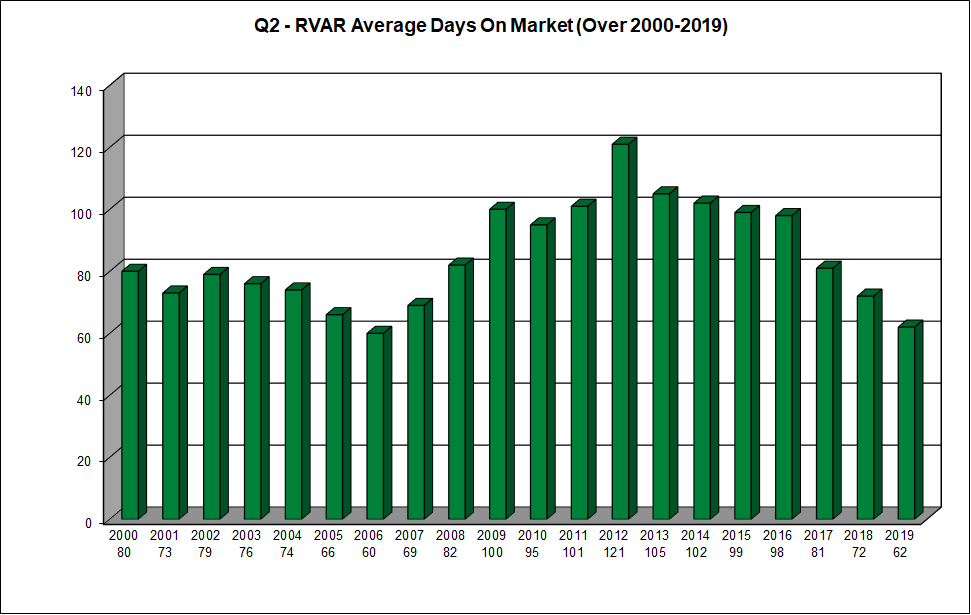
2nd Quarter – 2019 – AVERAGE DAYS ON MARKET (DOM)
– Chart below illustrates Q2 average DOM for each year from 2000 to 2019 (lower is better).
– Average Q2 DOM during those 20 years equals 85 days
– Q2 2019 DOM (62) is lower by 23 days (27.05% down) over 20-yr Q2 avg (85)
– Q2 2018 DOM (62) is lower by 10 days (13.89% down) from Q2 2018 (72)
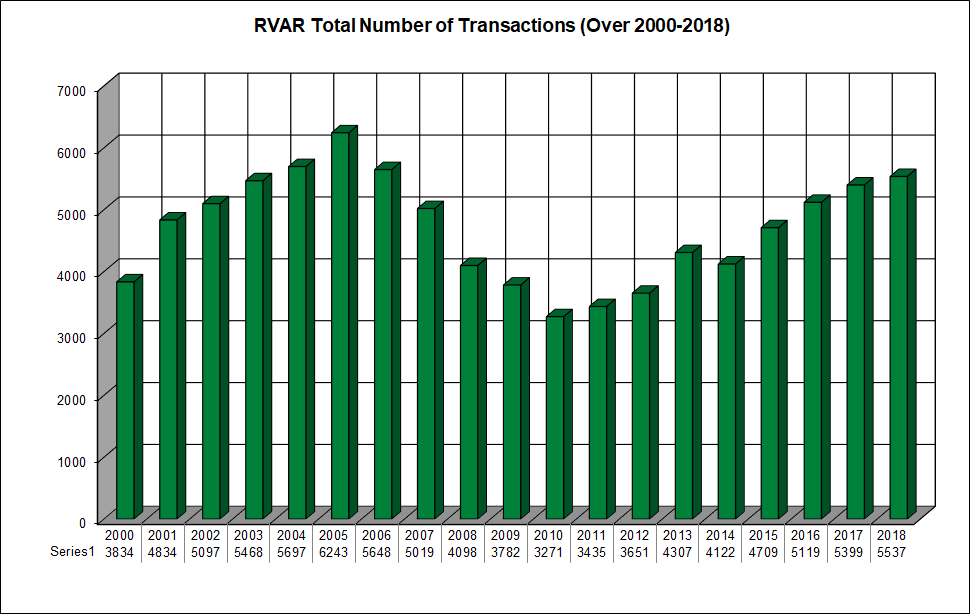
Total RVAR Annual Sales 2000 through end of 2018
– Chart below illustrates annual home sales for each year from 2000 to 2018.
– Average annual home sales during those 19 years equals 4,698 homes
– 2018 sales (5,537) higher by 138 homes (2.6% up) over 2017 sales (5,399)
– 2018 sales (5,537) higher by 839 homes (17.9% up) over 19 year avg (4,698)
TODAY’S MORTGAGE RATES** & HISTORY – As of 7/9/18
According to Bankrate.com the following mortgage interest rates** are available today:
30-Yr Fixed:
3.868% APR (3.750% rate, $300k loan, 20% down, 740+ credit, 0 pts, $1,111/mo payment)
15-Yr Fixed:
3.146% APR (3.125% rate, $300k loan, 20% down, 740+ credit, 0 pts, $1,672/mo payment)
5/1 Adj Rate:
4.171% APR (3.500% rate, $300k loan, 20% down, 740+ credit, 0 pts, $1,078/mo payment)
To see a chart of last 30 year history of mortgage rates: Click Here
Historical charts courtesy of Jamey Roberts at RMH Mortgage.
*The RVAR is the Roanoke Valley Association of Realtors and owns the Roanoke MLS
** All loans are subject to credit approval. These rates are not an offer of financing. Every home buyer must be approved through a qualified lender. Loan programs and rates subject to change. The Real Estate Group and/or LivingInRoanoke.com, and/or Patrick Wilkinson, is not / are not a lender.
Roanoke Valley Market Snapshot Q2 – 2019
P.S. DON’T KEEP US A SECRET!
PLEASE SHARE WITH FRIENDS!
– Patrick Wilkinson, Living In Roanoke