
 Roanoke Valley Market Snapshot
Q3 – 2018
By: Patrick Wilkinson
Posted 10/4/2018

Welcome to LivingInRoanoke.com Market Snapshot! You are very special to us, so please enjoy…
Here you’ll find in-depth analysis, but easy to digest graphs, of residential real estate sales for the Roanoke Valley of Virginia based on data from RVAR. Be sure to see trends in mortgage interest rates at the end of this report as well. You are welcomed to share this with your friends. You can even share on Facebook or Twitter (just click share buttons at the bottom of the page, thanks in advance).
BREAKING NEWS:
– HIGHEST NUMBER OF HOMES SOLD SINCE 2006!!!!! (SEE BELOW )
– ABSORPTION RATE IS 4.12 MONTHS
OVERALL THOUGHTS ON Q3 – 2018 MARKET SNAPSHOT
Sales of residential homes in the Roanoke Valley have been brisk so far in 2018 with a total of 4,228 homes sold (1.4% up from 4,186 at this point in 2017). Of those there were 1,535 homes sold in the third quarter (Q3). As you will see in the Total Number of Transactions graph (below) this is the highest number of home sold in Q3 since 2006! Additionally, homes are selling quickly! In Q3 of 2018 we are seeing the lowest number of days on market since 2006! In fact, these factors point to 2018 having the potential to be the best year since 2006.
Here’s why…. even though we are having high volumes of sales, there is still a low inventory of homes for sale, meaning fewer homes to choose from. This scarcity of homes, coupled with a roaring economy and plenty of home buyers, drives up the speed of purchasing. This phenomenon of quick buying ramps up the number of homes sold in short periods of time. There are two important indicators which point toward a scarcity of homes.
Indicator #1: “Active In Range” (or AIR) means number homes that were on the market during that time period. The Q3 AIR has significantly decreased each year since 2010, and is at its lowest point right now since 2002. This is great news for home sellers, and means homes are selling quickly and inventory is low.
– In Q3 of 2018 there were 4,317 homes AIR
– In Q3 of 2017 there were 4,630 homes AIR
– In Q3 of 2010 there were 7,246 homes AIR (worst days of the real estate crash)
– In Q3 of 2002 there were 4,039 homes AIR
Indicator #2: “Absorption Rate” which is the rate, expressed in months, at which the entire supply of homes will sell out. According to an article by NAR “six months’ supply is considered a balanced market.” The Q3 2018 Absorption Rate for the Roanoke Valley is 4.12 months.
This means 2018 is, and will continue to be, an excellent year for home-sellers (click here to get a free Comparative Market Analysis on your home). But sellers will only do well if buyers have access to great loans, interest rates, and other capital. We still have historically low mortgage interest rates, and excellent loan programs available to home buyers (click here if you are considering buying a home). Take a look at current interest rates at the very end of this post.
MORE GREAT NEWS! In a 9/13/18 article by Adam Desanctis with Freddie Mac “Overall, this spectacular stretch of solid job gains and low unemployment should help keep home buyer interest elevated.” Click Here to see the entire article from Freddie Mac
3rd Quarter – 2018 – HOME SALES
– Chart below illustrates Q3 home sales for each year from 2000 to 2018.
– Average Q3 home sales during those 19 years equals 1,337 homes
– Q3 2018 sales (1,535) are higher by 198 homes (14.8% up) over 19-yr Q3 average (1,337)
– Q3 2018 sales (1,535) are higher by 6 homes (00.3% up) from Q3 2017 (1,529)
![]()
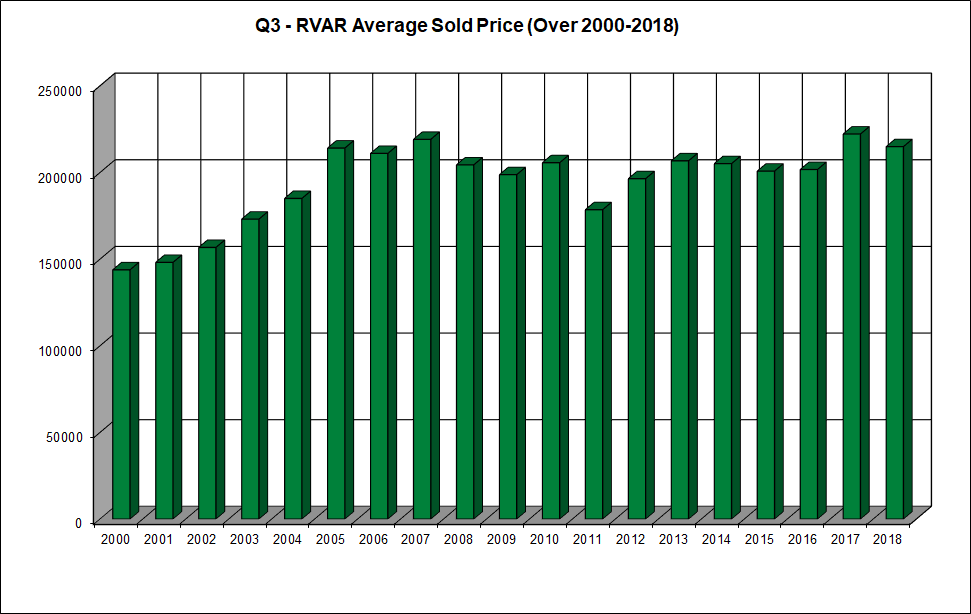
3rd Quarter – 2018 – AVERAGE PRICE Market Snapshot
– Chart below illustrates Q3 average sales price for each year from 2000 to 2018.
– Average Q3 home sales price during those 19 years equals $194,023
– Q3 2018 avg price ($214,927) is higher by $20,904 (10.8% up) over 19-yr Q3 avg ($194,023)
– Q3 2018 avg price ($214,927) is lower by $7,283 (3.3% down) from Q3 2017 ($222,210)
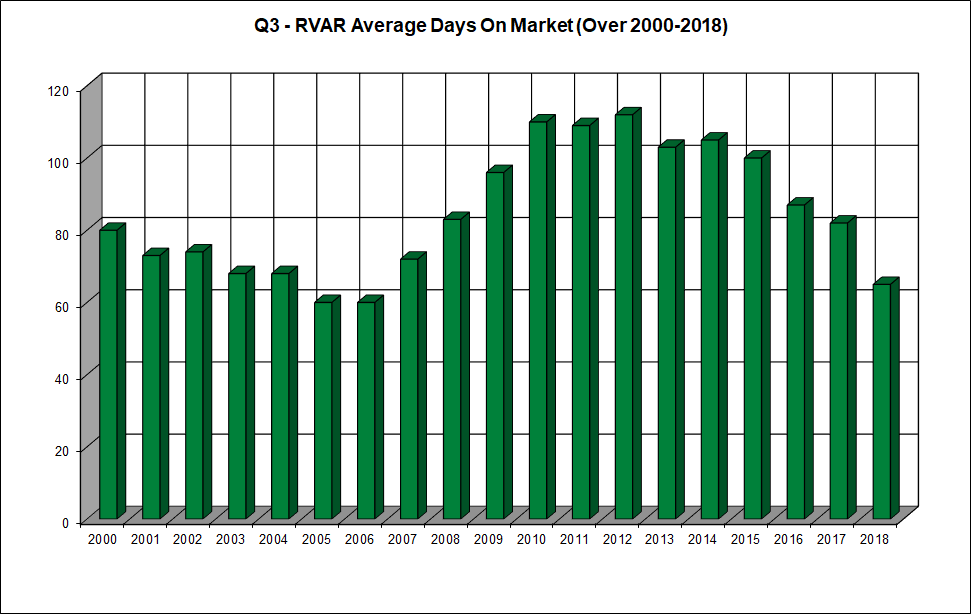
3rd Quarter – 2018 – AVERAGE DAYS ON MARKET (DOM)
– Chart below illustrates Q3 average DOM for each year from 2000 to 2018.
– Average Q3 DOM during those 19 years equals 85 days
– Q3 2018 DOM (65) is lower by 20 days (23.5% down) from 19-yr Q3 avg (85) GOOD!
– Q3 2018 DOM (65) is lower by 17 days (20.7% down) from Q3 2017 (82) ALSO GOOD!
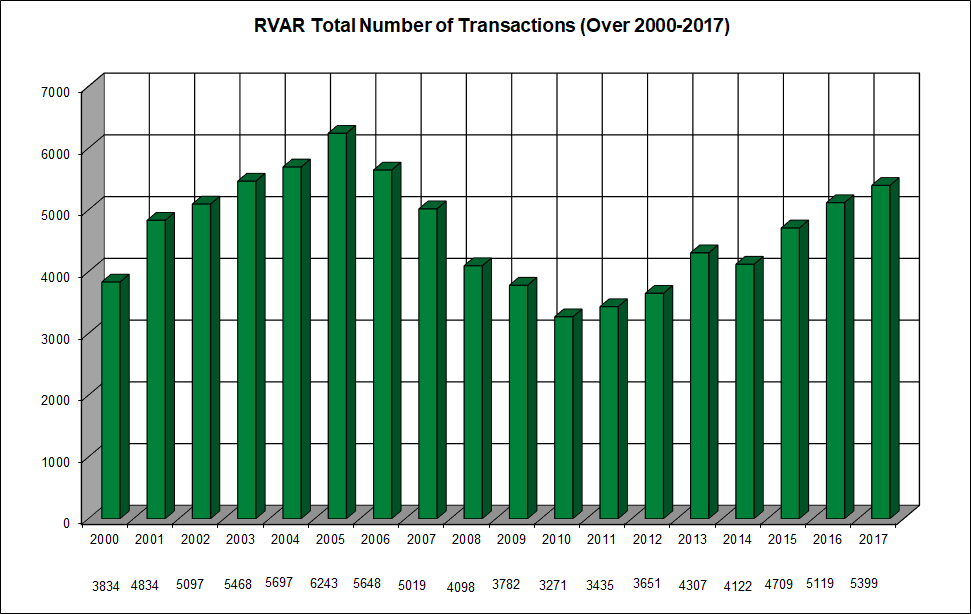
Total RVAR Annual Sales 2000 through end of 2017
– Chart below illustrates annual home sales for each year from 2000 to 2017.
– Average annual home sales during those 18 years equals 4,651 homes
– 2017 sales (5,399) higher by 280 homes (5.5% up) over 2016 sales (5,119)
– 2017 sales (5,399) higher by 748 homes (16.0% up) over 18 year avg (4,651)
– We’ll update this chart to 2018 numbers as soon as this year is over….
TODAY’S MORTGAGE RATES** & HISTORY – As of 10/4/18
According to Bankrate.com the following mortgage interest rates** are available today:
30-Yr Fixed:
4.555% APR (4.500% rate, $300k loan, 20% down, 740+ credit, 0 pts, $1,216/mo P&I payment)
15-Yr Fixed:
3.953% APR (3.875% rate, $300k loan, 20% down, 740+ credit, 0 pts, $1,760/mo P&I payment)
10 Yr Fixed:
3.958% APR (3.750% rate, $300k loan, 20% down, 740+ credit, 0 pts, $2,401/mo P&I payment)
5/1 Adj Rate:
4.751% APR (4.000% rate, $300k loan, 20% down, 740+ credit, 0 pts, $1,146/mo P&I payment)
To see a chart of last 30 year history of mortgage rates: Click Here
Historical charts courtesy of Jamey Roberts at Residential Mortgage Services.
*The RVAR is the Roanoke Valley Association of Realtors and owns the Roanoke MLS
** All loans are subject to credit approval. These rates are not an offer of financing. Every home buyer must be approved through a qualified lender. Loan programs and rates subject to change. The Real Estate Group and/or LivingInRoanoke.com, and/or Patrick Wilkinson, is not / are not a lender.
P.S. PLEASE DON’T KEEP US A SECRET!
CLICK FACEBOOK OR TWITTER SHARE BUTTONS BELOW!
THANKS A MILLION! -The Living In Roanoke Team
CLICK HERE FOR THE “CONTACT US” PAGE