
 Roanoke Valley Market Snapshot
Q1 – 2018
By: Patrick Wilkinson
Posted 4/11/2018
Welcome to LivingInRoanoke.com! You are very special to us, so please enjoy…
Here you’ll find in-depth analysis, but easy to digest spiffy graphs, of residential real estate sales for the Roanoke Valley of Virginia based on data from RVAR. Be sure to see trends in mortgage interest rates at the end of this report as well. I only send this out to my past clients and friends, but you are welcomed to share this with your friends.
OVERALL THOUGHTS ON Q1 – 2018
Sales of residential homes in the Roanoke Valley were brisk in the first quarter of 2018 with a total of 1,048 homes sold. While it may be appear to be a slower start than 2017, don’t be distracted by that quarterly number. If we dig just a little deeper we’ll see that 2018 is setting up to be possibly the best year since 2005 (maybe even better). Here’s why…. there are fewer homes to choose from and sellers are finally doing well! There are two terms to remember to truly understand this.
First, “Active In Range” (or AIR) means number homes that were on the market during that time period. The Q1 AIR has significantly decreased each year since 2011 (which was a rough year in real estate), and is at its lowest point right now since 2001. This is good news for home sellers, and means homes are selling quite well.
– In Q1 of 2018 there were 3,875 homes AIR
– In Q1 of 2017 there were 4,372 homes AIR
– In Q1 of 2011 there were 6,261 homes AIR (dark days of the real estate crash)
– In Q1 of 2001 there were 3,761 homes AIR
And second, “Absorption Rate” which is the rate, expressed in months, at which the entire supply of homes will sell out. According to an article by NAR “six months’ supply is considered a balanced market.” The Q1 2018 Absorption Rate for the Roanoke Valley is 5.2 months.
This sets up 2018 to be an excellent year for home-sellers. But sellers only do well if buyers have access to great loans. This is still the case with the historically low mortgage interest rates, and excellent loan programs available to home buyers. Take a look at rates at the end of this post.
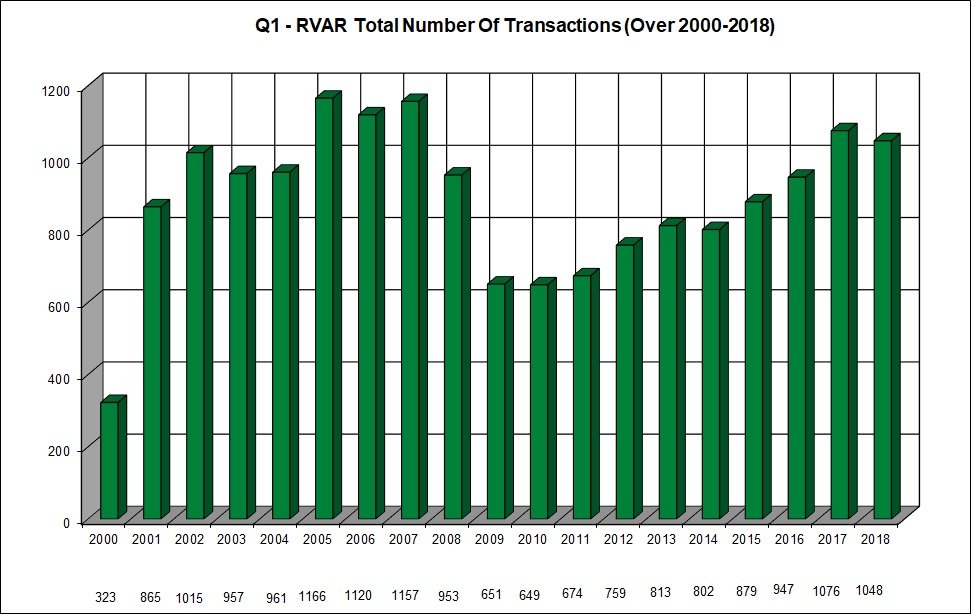
1st Quarter – 2018 – HOME SALES
– Chart below illustrates Q1 home sales for each year from 2000 to 2018.
– Average Q1 home sales during those 19 years equals 885 homes
– Q1 2018 sales (1,048) are higher by 163 homes (18.4% up) over 19-yr Q1 average (885)
– Q1 2018 sales (1,048) are lower by 28 homes (2.6% down) from Q1 2017 (1,076)
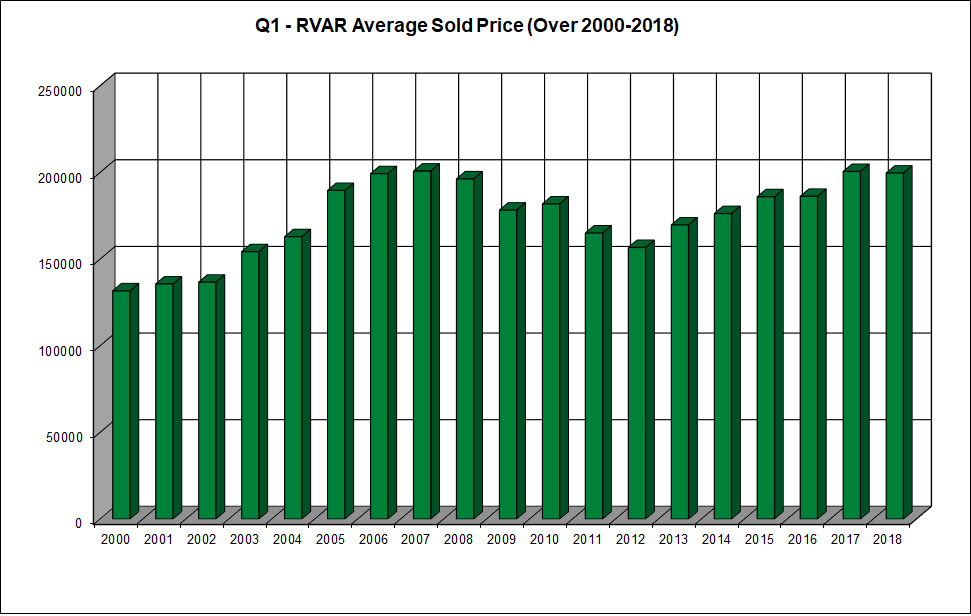
1st Quarter – 2018 – AVERAGE PRICE
– Chart below illustrates Q1 average sales price for each year from 2000 to 2018.
– Average Q1 home sales price during those 19 years equals $174,132
– Q1 2018 avg price ($199,706) is higher by $25,574 (14.7% up) over 19-yr Q1 avg ($174,132)
– Q1 2018 avg price ($199,706) is lower by $918 (0.5% down) from Q1 2017 ($200,624)
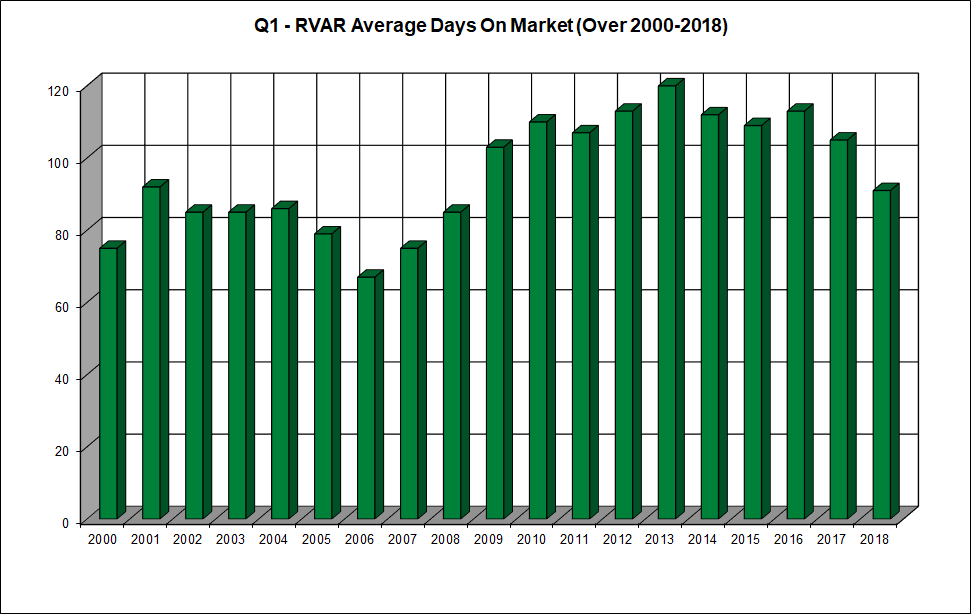
1st Quarter – 2018 – AVERAGE DAYS ON MARKET (DOM)
– Chart below illustrates Q1 average DOM for each year from 2000 to 2018.
– Average Q1 DOM during those 19 years equals 95 days
– Q1 2018 DOM (91) is lower by 4 days (4.2% down) over 19-yr Q1 avg (95) GOOD!
– Q1 2018 DOM (91) is lower by 14 days (13.3% down) from Q1 2017 (105) ALSO GOOD!
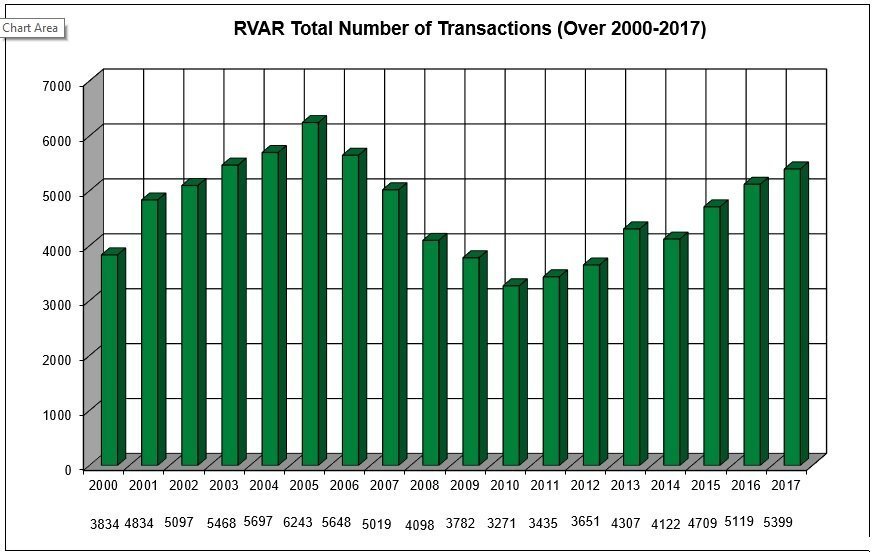
Total RVAR Annual Sales 2000 through end of 2017
– Chart below illustrates annual home sales for each year from 2000 to 2017.
– Average annual home sales during those 18 years equals 4,651 homes
– 2017 sales (5,399) higher by 280 homes (5.5% up) over 2016 sales (5,119)
– 2017 sales (5,399) higher by 748 homes (16.0% up) over 18 year avg (4,651)
TODAY’S MORTGAGE RATES** & HISTORY – As of 4/11/18
According to Bankrate.com the following mortgage interest rates** are available today:
30-Yr Fixed:
4.297% APR (4.250% rate, $300k loan, 20% down, 740+ credit, 0 pts, $1,181/mo payment)
15-Yr Fixed:
3.625% APR (3.644% rate, $300k loan, 20% down, 740+ credit, 0 pts, $1,730/mo payment)
10 Yr Fixed:
3.351% APR (3.240% rate, $300k loan, 20% down, 740+ credit, 0 pts, $2,344/mo payment)
5/1 Adj Rate:
4.183% APR (3.390% rate, $300k loan, 20% down, 740+ credit, 0 pts, $1,063/mo payment)
To see a chart of last 30 year history of mortgage rates: Click Here
Historical charts courtesy of Mortgage News Daily.
*The RVAR is the Roanoke Valley Association of Realtors and owns the Roanoke MLS
** All loans are subject to credit approval. These rates are not an offer of financing. Every home buyer must be approved through a qualified lender. Loan programs and rates subject to change. The Real Estate Group and/or LivingInRoanoke.com, and/or Patrick Wilkinson, is not / are not a lender.
P.S. DON’T KEEP US A SECRET!
PLEASE SHARE WITH FRIENDS!
-The Living In Roanoke Team