
Roanoke Valley Market Snapshot Q2 2020
By: Patrick Wilkinson
Posted 7/15/2020

Welcome to LivingInRoanoke.com’s Market Snapshot! You are very special to me, so please enjoy…
Here you’ll find in-depth analysis, graphs and data, of residential real estate sales for the Roanoke Valley of Virginia based on data from RVAR. Be sure to see trends in mortgage interest rates at the end. You are welcomed to share this with your friends, and share on Facebook or Twitter (just click share buttons at the top or bottom of the page). Thanks! Patrick
I WAS WRONG… THE NEWS IS ACTUALLY VERY GOOD!
“The Great Shut Down” took another bite out of the numbers and Q2 2020 ended with Roanoke Valley homes sales down about 7.7% from Q2 2019. No discussion of Q2 2020 would be complete without mentioning “The Virus Crisis” and its effect on the US Economy. The Roanoke Valley was on track to have a record 2020 with the great Q1 numbers. As I said 3 months ago, “The numbers for the 2nd Quarter of 2020 will show the true effect of what has transpired, and it may not be pretty.” BUT I WAS WRONG!!!
Here’s the GREAT NEWS. The economic fundamentals were excellent prior to this forced shut down, and it now looks as though we’re snapping back to very good economic fundamentals. In fact, the total 1st HALF of 2020 sales total is actually EXCEEDING 2019 in all areas. My Q2 2020 “pent up demand” theory, which I predicted 3 months ago was correct, but has exceeded my expectations. Here’s my updated theory on why things are going so well.
THEROY – WHY REAL ESTATE SALES ARE ON FIRE
- National unemployment rate reached about 20% maximum, still 80% employed
- Unemployed were, for the most part, in entry level or lower income positions
- Those still employed still had income, liquid funds, and good credit for a loan
- The interest rates plummeted due to economic fear (see bottom of this report)
- Some sellers began removing homes from MLS in March in fear of catching illness
- Limited homes available set up a frenzy for buyers who could still buy
- And that buying frenzy continues for properly priced homes today…
It is possible, once The Roanoke Valley has fully rebounded, that we’ll see a housing boom like there hasn’t been in 60 years. And it is possible this comeback will more than make up for the weakness caused by the shut down in Q2 & Q3 2020.
Q2 2020 THOUGHTS
Sales of Q2 2020 residential property in the Roanoke Valley were strong, 1,552 homes sold (RVAR to date for Q2). BUT the TOTAL number of homes sold in the entire 1st HALF of 2020 was 2,824 homes, as compared to 1st half of 2019 at 2,780 homes (a 1.6% increase for 2020). Additionally, the average sale price in 2020 is higher, and the days on the market are lower than 2019 (see charts below). So 2020 is still setting up to be the best year in Roanoke Valley history. Here are the two BIG indicators of future sales growth:
First, “Active In Range” (or AIR) means number homes that were on the market during that time period. The Q2 AIR has significantly decreased each year since 2011 (bottom of the market), and is at its lowest point right now ever. This is good news for home sellers because fewer active homes on the market means there is less competition for qualified buyers.
– In Q2 of 2020 there were 3,416 homes AIR (lower is better!)
– In Q2 of 2019 there were 4,174 homes AIR
– In Q2 of 2011 there were 6,625 homes AIR (dark days of the real estate crash)
And second, “Absorption Rate” which is the rate, expressed in months, at which the entire supply of homes will sell out if no more homes were added to the market. According to an article by NAR “six months‘ supply is considered a balanced market.” The Q2 2020 Absorption Rate for the Roanoke Valley was 1.67 months (until all inventory would be sold out).
This means 2020 is currently a phenomenal year for home-sellers. And sellers only do well if buyers have access to great loans. Interest rates have come down significantly in the last 3 months to historic lows, making excellent loan programs are available to home buyers. Take a look at rates at the end of this post.
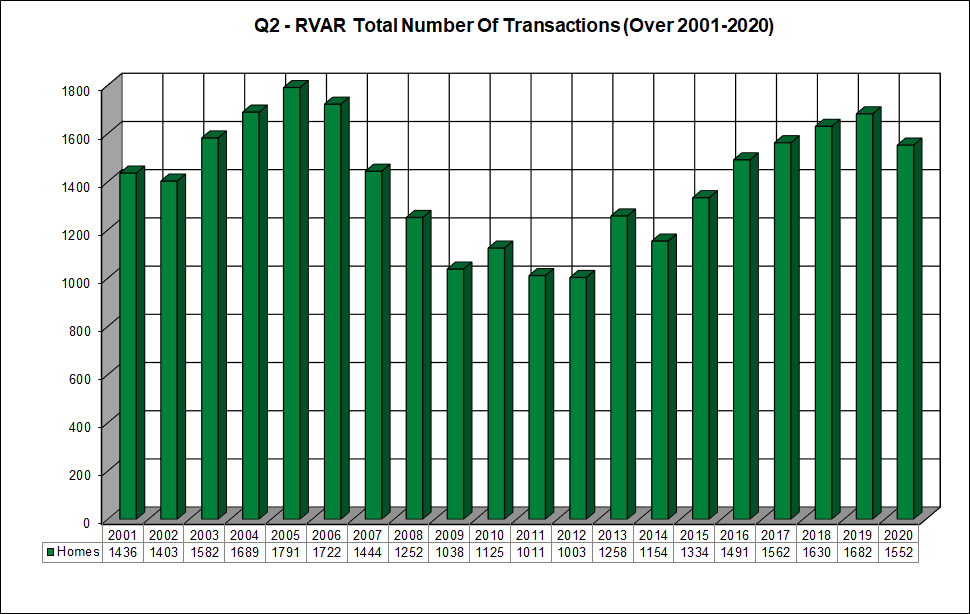
2nd Quarter – 2020 – HOME SALES (Took a hit)
– Chart below illustrates Q2 home sales for each year from 2001 to 2020
– Average Q2 home sales during those 20 years equals 1,408 homes
– Q2 2020 sales (1,552) are higher by 144 homes () over 20-yr Q2 average (1,408)
– Q2 2020 sales (1,552) are lower by 130 homes (11.74% down) from Q2 2019 (1,682)
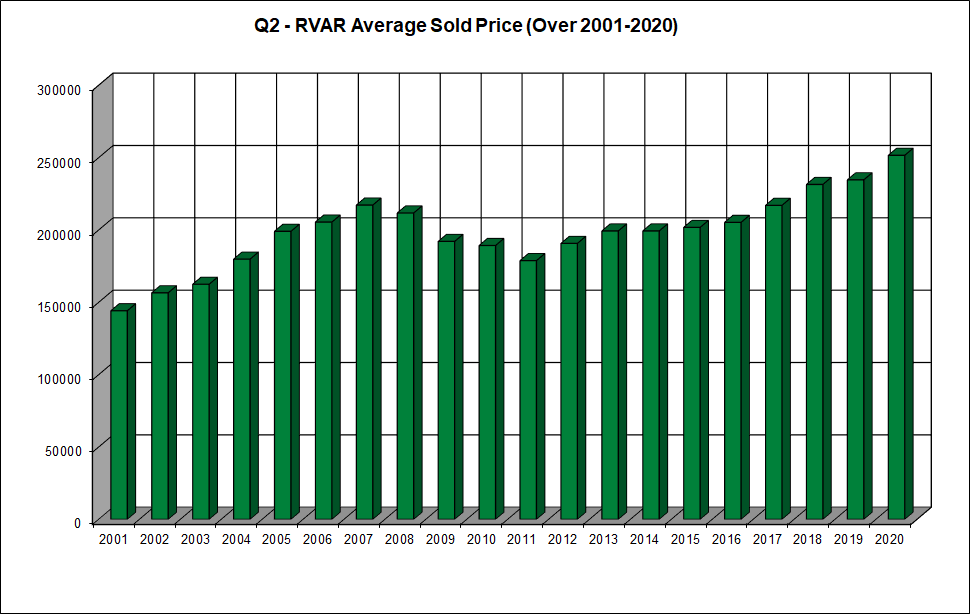
2nd Quarter – 2020 – AVERAGE PRICE ()
– Chart below illustrates Q2 average sales price for each year from 2001 to 2020.
– Average Q2 home sales price during those 20 years equals $198,379
– Q2 2020 avg price ($251,583) higher by $53,204 () over 20-yr Q2 avg ($198,379)
– Q2 2020 avg price ($251,583) higher by $16,926 () from Q2 2019 ($234,657)
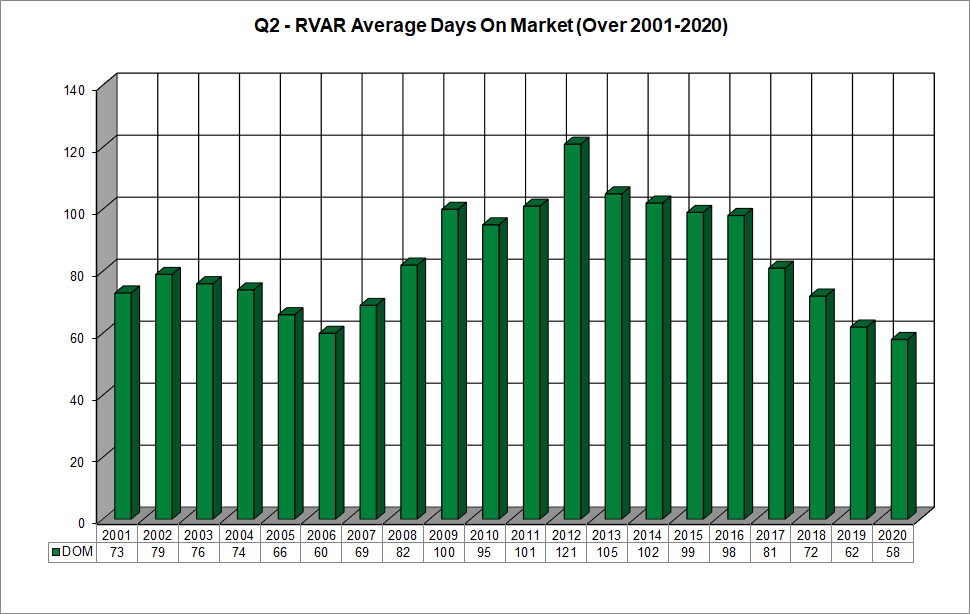
2nd Quarter – 2020 – AVERAGE DAYS ON MARKET (DOM) ()
– Chart below illustrates Q2 average DOM for each year from 2001 to 2020.
– Average Q2 DOM during those 20 years equals 84 days
– Q2 2020 DOM (58) is lower by 26 days (30.95% down) over 20-yr Q2 avg (84)
– Q2 2020 DOM (58) is lower by 4 days (6.45% down) from Q2 2019 (62)
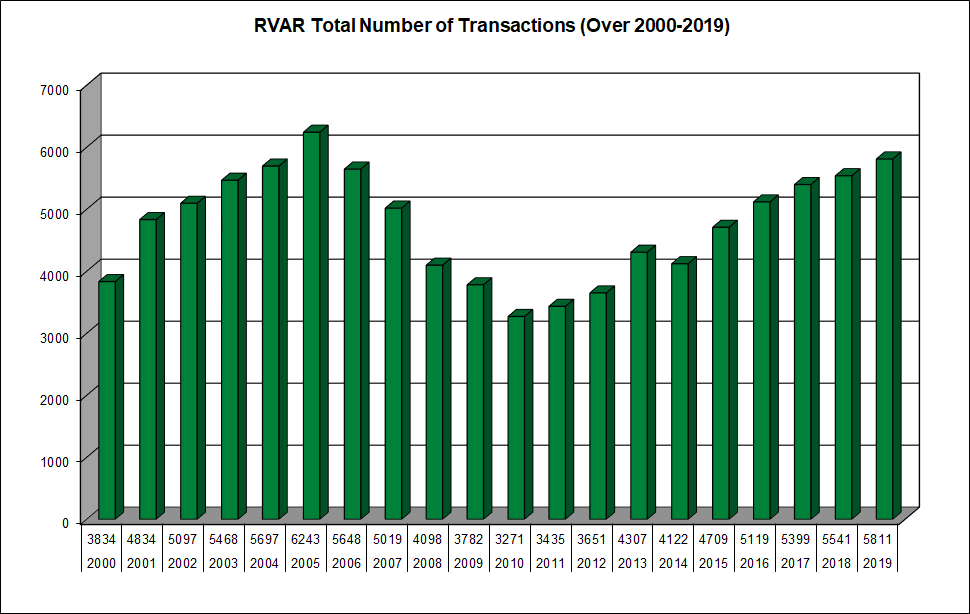
Total RVAR Annual Sales 2000 through end of 2019 (will update at end of 2020)
– Chart below illustrates annual home sales for each year from 2000 to 2019.
– Average annual home sales during those 20 years equals 4,754 homes
– 2019 sales (5,811) higher by 1,057 homes () over 20 year avg (4,754)
– 2019 sales (5,811) higher by 270 homes () over 2018 sales (5,541)
TODAY’S MORTGAGE RATES** & HISTORY – As of 7/15/2020
According to Bankrate.com the following mortgage interest rates** are available today on a $375,000 purchase price (monthly payment combines only principal and interest)
30-Yr Fixed:
3.279% APR (3.250% rate, $300k loan, 20% down, 740+ credit, 0 pts, $1,306/mo payment)
15-Yr Fixed:
2.927% APR (2.875% rate, $300k loan, 20% down, 740+ credit, 0 pts, $2,054/mo payment)
5/1 Adj Rate:
2.707% APR (2.875% rate, $300k loan, 20% down, 740+ credit, 0 pts, $1,245/mo payment)
To see a chart of last 30 year history of mortgage rates: Click Here
Historical charts courtesy of Jamey Roberts at RMH Mortgage.
*The RVAR is the Roanoke Valley Association of Realtors and owns the Roanoke MLS, from which all RVAR housing data was obtained.
** All loans are subject to credit approval. These rates are not an offer of financing. Every home buyer must be approved through a qualified lender. Loan programs and rates subject to change. The Real Estate Group and/or LivingInRoanoke.com, and/or Patrick Wilkinson, is not / are not a lender.
The Roanoke Valley Market Snapshot Q2 2020
– Patrick Wilkinson, Living In Roanoke