 2019 Annual Roanoke Valley Market Snapshot
By: Patrick Wilkinson
Posted 1/13/2020

BRACE YOURSELVES! 2020 may become the Roanoke Valley’s most record-setting year in history. Healthy 2019 home sales in the Roanoke Valley were 4.4% higher than in 2018, and the highest number sold since 2005. But in the run up to 2005 the high volume was inflated greatly by faulty lending practices in the “sub-prime” category, which is not the case today. I predict that seller’s homes will sell briskly in 2020, and buyers will get into multiple-offer competition on fairly-priced homes. Here’s a recap of three key indicators for the past 20 years (Total Sales, Average Price, and Days On Market). Also keep scrolling to see National Trends in the US. Please be sure to share this with your friends and family. Enjoy!
-Patrick Wilkinson
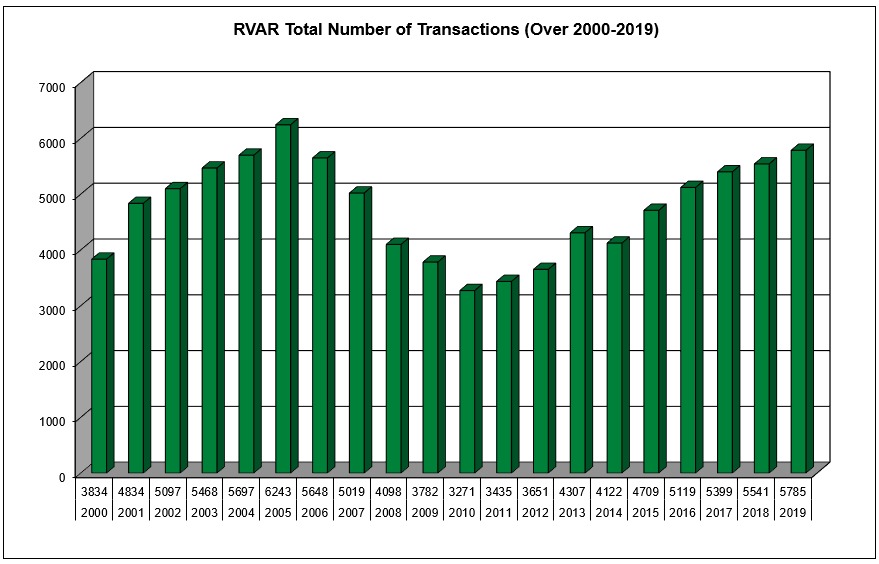
ANNUAL SALES – SECOND HIGHEST IN ROANOKE VALLEY HISTORY
– Chart below illustrates annual home sales for each year from 2000 to 2019
– Average annual home sales during those 20 years equals 4,752 homes/year
– 2019 sales (5,785) are the highest on record since 2005 (6,243 sales)
– 2019 sales (5,785) higher by 1,033 homes (21.7% up) over 20 year avg (4,752)
– 2019 sales (5,785) higher by 244 homes (4.4% up) over 2018 sales (5,541)
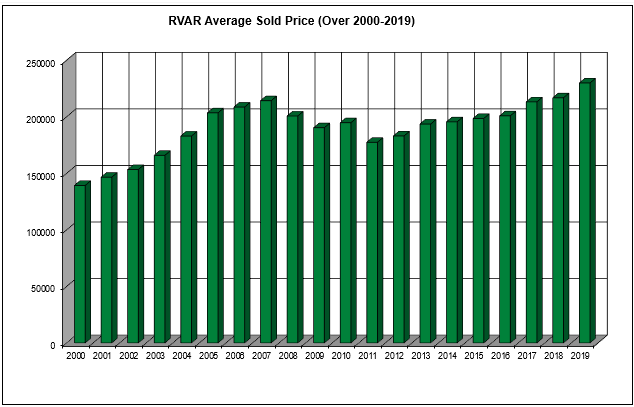
AVERAGE PRICE – RECORD HIGHEST IN ROANOKE VALLEY HISTORY
– Chart below illustrates annual average sales price from 2000 to 2019.
– Average home sales price during those 20 years equals $190,461
– 2019 avg price ($229,912) is the highest on record for The Roanoke Valley
– 2019 avg price ($229,912) is higher by $39,451 (20.7% up) over 20-yr avg ($190,461)
– 2019 avg price ($229,912) is higher by $13,123 (6.1% up) from 2018 ($216,798)
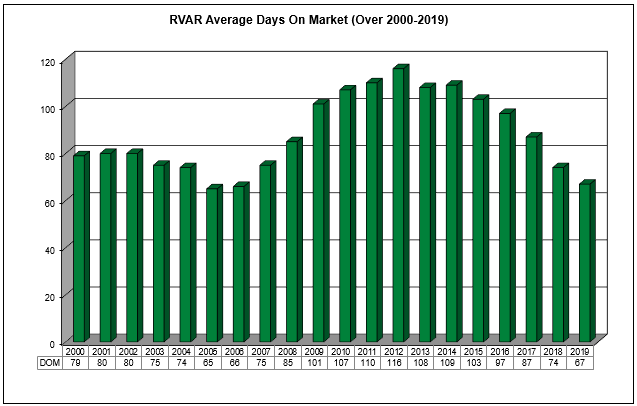
AVERAGE DAYS ON MARKET (DOM)
– Chart below illustrates average DOM for each year from 2000 to 2019.
– Average DOM during those 20 years equals 88 days
– 2019 Avg DOM (67) is the lowest on record since 2007
– 2019 Avg DOM (67) is lower by 21 days (23.8% down) from 20-yr avg (88) GOOD!
– 2019 Avg DOM (67) is lower by 7 days (9.5% down) from 2018 (74) ALSO GOOD!
NATIONAL TRENDS
Below you’ll find national trends that are building a firm foundation for 2020 to be an excellent year for everyone. Click the green links or images to see all of the great news!
CNBC.com
High home-builder confidence
Census.gov
High New Home Sales
Bureau of Labor Statistics, BLS.com
Low Unemployment Rate
John Barsanti Jr., ItsTheEconomy.com
Enormous Retail Sales
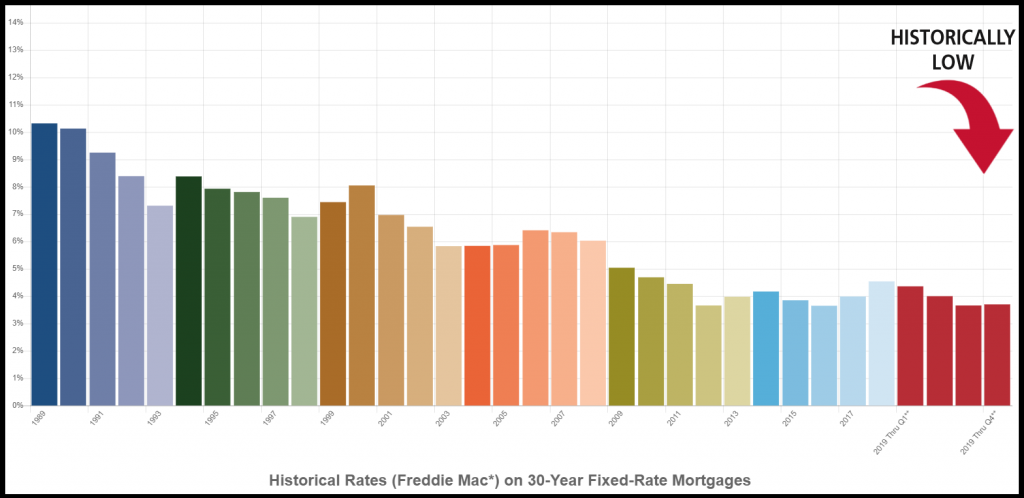
Mortgage Interest Rates Last 30 Years
Click Here For Interactive Chart
Housing Price Appreciation By State
Click Here For Interactive Map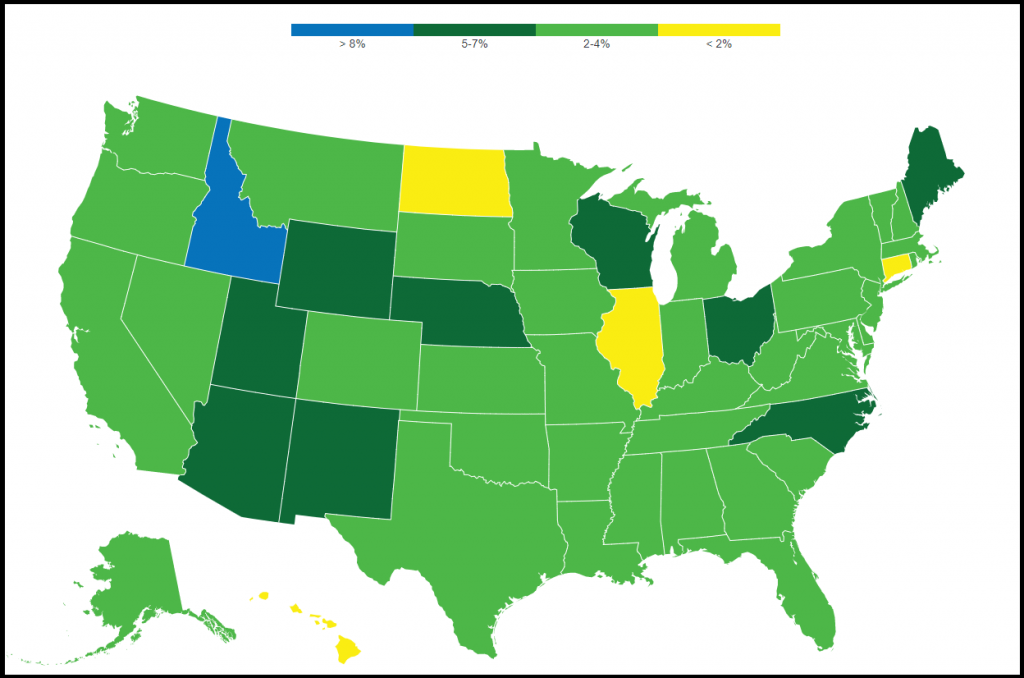
Housing Price Appreciation In The Top 20 Cities
Click Here For Interactive Chart
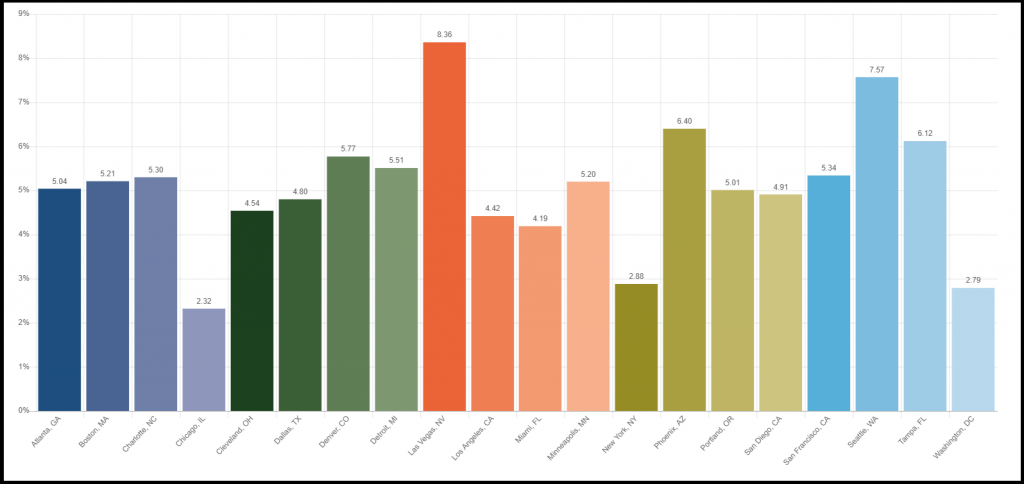
Historical charts courtesy of Jamey Roberts at Residential Mortgage Services.
TODAY’S MORTGAGE RATES** – As of 1/13/2020
According to Bankrate.com the following mortgage interest rates** are available today:
30-Yr Fixed Conventional:
3.922% APR (3.875% rate $300k loan 20% down 740+ credit 0 pts $1129/mo P&I)
15-Yr Fixed Conventional:
3.539% APR (3.500% rate $300k loan 20% down 740+ credit 0 pts $1716/mo P&I)
10 Yr Fixed Conventional:
3.517% APR (3.500% rate $300k loan 20% down 740+ credit 0 pts $2373/mo P&I)
30-Yr Fixed FHA:
3.919% APR (3.875% rate $300k loan 5% down 740+ credit 0 pts $1340/mo P&I)
15-Yr Fixed FHA:
3.679% APR (3.500% rate $300k loan 5% down 740+ credit 0 pts $2130/mo P&I)
*The RVAR is the Roanoke Valley Association of Realtors and owns the Roanoke MLS
** All loans are subject to credit approval. These rates are not an offer of financing. Every home buyer must be approved through a qualified lender. Loan programs and rates subject to change. The Real Estate Group and/or LivingInRoanoke.com, and/or Patrick Wilkinson, is not / are not a lender. 2019 Annual Roanoke Valley Market Snapshot
P.S. PLEASE DON’T KEEP US A SECRET!

